PhD Thesis diagrams and statistical graphics – University of Reading
I designed the insides of my thesis too. Diagrams and statistical graphics played a key role in explaining the findings and theories discussed in my PhD thesis.
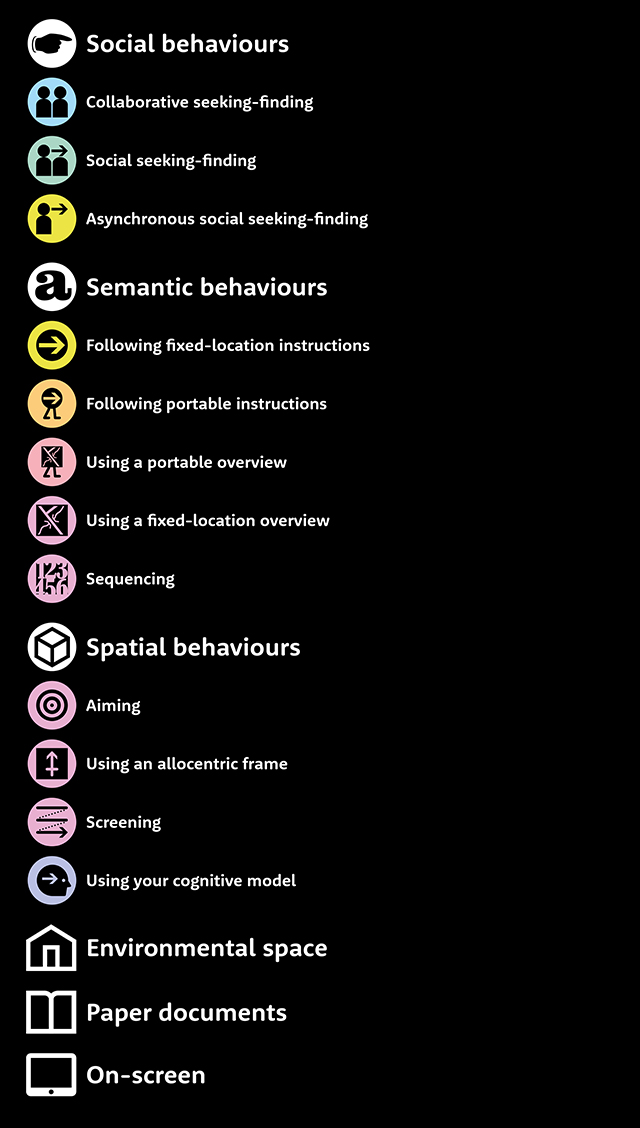
I designed a set of icons that were used to support particular pieces of terminology when they occurred in the diagrams and statistical graphics.
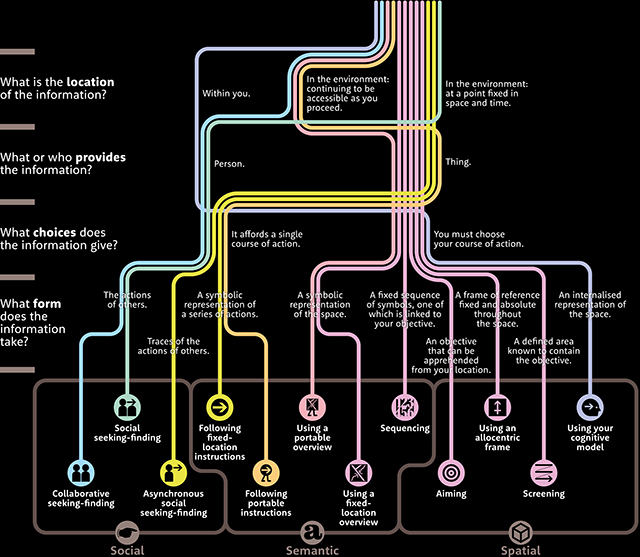
One of the key places that used these icons was in the diagram that supported the explanation of the taxonomy.
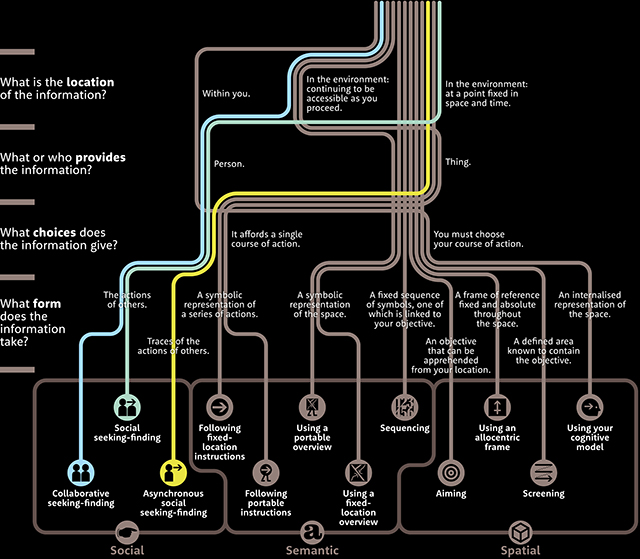
This taxonomy diagram is then used to support the discussions about social, semantic, and spatial categories of behaviour. Shown here is the one for social behaviours.
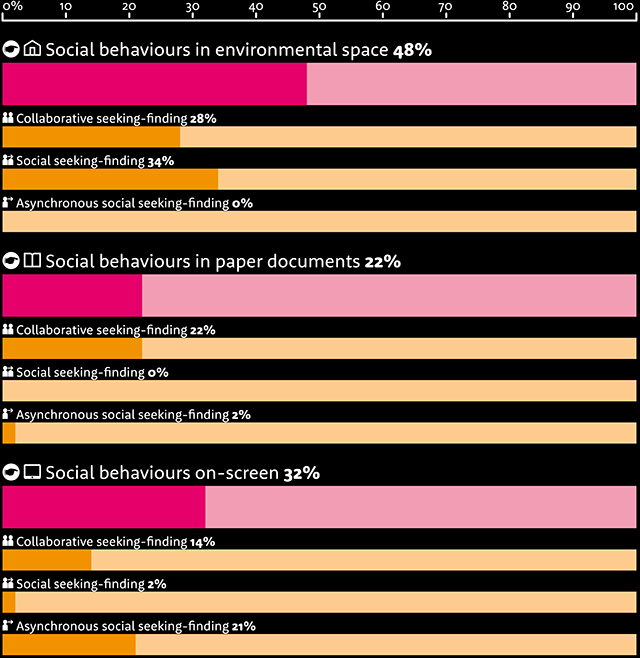
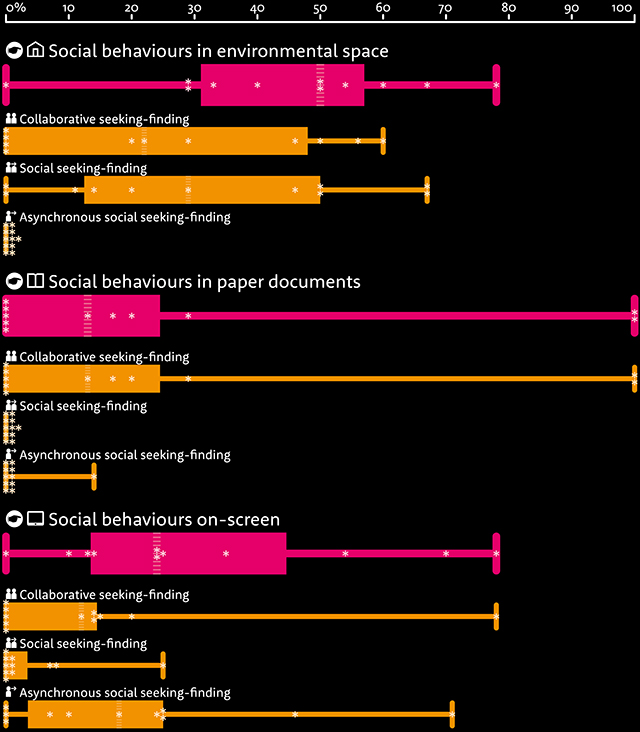
The icons are also used in the statistical graphics, such as this one: